Using an event for all tables in one page but only on the rows inside the table clicked

Using an event for all tables in one page but only on the rows inside the table clicked

MelodyNelsonMelodyNelson Posts: 213Questions: 33Answers: 2

Link to test case:
Debugger code (debug.datatables.net):
Error messages shown:
Description of problem:

Hi,

I have a page with 8 tables including 4 tables like this one :
https://live.datatables.net/xomujosa/10/edit

I'm using this event to show/hide the months when a row of a trimestrer is clicked.

table2.on('click', '.trimestre', function () {
        var id = this.id;
        var child = '.child.' + id;
        $( child ).toggle();
    });

It works but all the tables eare targeted.
If I click on the row « Trimestre 1 », this row will be expand for the 4 similar tables.
I don't know how to target only the table where the row is clicked.

Also, I wish I could write only one function for the 4 tables.
I tried using jQuery like that but it doesn't work on the rows created by the rowgrouping extension (subject already talked about in another thread)

$("#table1 tr.trimestre, #table2 tr.trimestre, #table3 tr.trimestre, #table4 tr.trimestre").click(function(){
        var id = this.id;
        var child = '.child.' + id;
        $( child ).toggle();
     });

Thanks for your help

«1

Replies

  • kthorngrenkthorngren Posts: 21,336Questions: 26Answers: 4,951
    edited September 12

    It works but all the tables eare targeted.

    That suggest the selector child in $( child ).toggle(); is not unique on the page. Try changing the selector to include the specific table, for example:

    $( child, '#table2' ).toggle();
    

    Also, I wish I could write only one function for the 4 tables.

    Its possible. One way is to use a selector like this:

    $('table.dataTable')
        .on('click', 'tr.trimestre', function () {
    

    This example shows how to get the clicked table and row data:
    https://live.datatables.net/xojeworo/1/edit

    For this solution I think you would use a selector like this:

    $( child, table ).toggle();
    

    Kevin

  • kthorngrenkthorngren Posts: 21,336Questions: 26Answers: 4,951

    I should mention that I applied the trimestre class to only Brielle Williamson row in the first table and Ashton Cox row in the second table. I thought this would help highlight the click event works on different tables.

    Kevin

  • MelodyNelsonMelodyNelson Posts: 213Questions: 33Answers: 2

    Hi Kevin,

    Thank you for your example.

    I've changed it to try to understand everything and replicate what I want to achieve :
    - rowgrouping
    - hidding by default the rows inside of the groups (the « childs »)
    - I have put the class and IDs I'm using on my page to the rows (using data from the example instead of number of trimesters and months)
    - then, add jQuery UI toggle on the groups (the « parents », they have the « trimestre » class) to show/hide the « children ». This part is not added yet because I've already broke the page :smiley:

    https://live.datatables.net/xojeworo/15/edit

  • kthorngrenkthorngren Posts: 21,336Questions: 26Answers: 4,951

    Your test case is getting this error:

    Uncaught TypeError: Cannot read properties of undefined (reading '0')

    The row being clicked on is not a Datatables row so the result of this:

    var data = table.row( $(this) ).data();
    

    is undefined.

    You don't need that statement so remove it and the associated console.log statement.

    One problem with your test case is you are creating non-unique IDs on the page. I suspect you don't need to assign or use an ID for the RowGroup rows. Just get the row to use as the selector for .toggle(). For example:
    https://live.datatables.net/lonidako/1/edit

    Using $( groupRow, table ).toggle(); causes the RowGroup row to disappear but I suspect its due to not having the code to handle the toggle. But it shows that only the row clicked is affected.

    Hope this gets you going. If not please update the test case to include your toggle code.

    Kevin

  • MelodyNelsonMelodyNelson Posts: 213Questions: 33Answers: 2

    Thanks for the debug Kevin

    This is another version reflecting what's going on with my website.

    The toggle fucntion is working but on every table

    Ex : you click on London, the group London will show/hide the rows relatives to the group but for every table

    I if can't target the table in the toogle function, I think I should had the table ID to the rows ID.

    https://live.datatables.net/yujefubu/1/edit

  • allanallan Posts: 63,498Questions: 1Answers: 10,471 Site admin

    Your ids are not unique. That actually makes it invalid HTML. I think you need to find a way to make the ids unique - perhaps prefixing or postfixing the host table's id to the group id.

    You can get the table's id using table.table().node().id.

    Allan

  • allanallan Posts: 63,498Questions: 1Answers: 10,471 Site admin

    Your ids are not unique (e.g. you have two trimestreLondon elements). That actually makes it invalid HTML. I think you need to find a way to make the ids unique - perhaps prefixing or postfixing the host table's id to the group id.

    You can get the table's id using table.table().node().id.

    Allan

  • kthorngrenkthorngren Posts: 21,336Questions: 26Answers: 4,951
    edited September 13

    Another option to eliminate duplicated ids is to use HTML5 data-* attributes instead. In the click event use jQuery closest() to get the table which will be used as part of the toggle() selector to limit the elements to find to just that table.

    I updated three lines in the test case to change from using id to using HTML5 data-* attributes:

    // createdRow
    $(row).data('group-id', 'trimestre' + data[2] + '_mois' + dataIndex);
    
    // startRender
    return $('<tr data-group-id="trimestre' + group + '" />')
    
    // click event
    var rowID = $( groupRow ).data('group-id');
    

    I changed the toggle() selector to this:

     $( child, table ).toggle();
    

    https://live.datatables.net/yujefubu/2/edit

    Now only the group for the particular table toggled open/closed.

    BTW, Thanks for the simplified test case. Its much easier to help :smile:

    Kevin

  • MelodyNelsonMelodyNelson Posts: 213Questions: 33Answers: 2

    Your ids are not unique (e.g. you have two trimestreLondon elements). That actually makes it invalid HTML. I think you need to find a way to make the ids unique - perhaps prefixing or postfixing the host table's id to the group id.
    You can get the table's id using table.table().node().id.

    I knew it and tried to do it earlier but failed.
    Believe me I'm trying a lot of things before posting but I'm missing a lot of things because I'm beginning with JS and also my english is not so good. When I read the doc, sometimes I don't even understand the examples :\

    The IDs was not the best idea, Kevin's idea is better on the next post but I didn't think of it.

  • kthorngrenkthorngren Posts: 21,336Questions: 26Answers: 4,951

    Using Jquery UI toggle() is a clever solution. I don't think you have this issue because I think all your data is on one page but the toggle only works on the page displayed. There are other solutions on the forum that keep track of the collapsed groups using a variable. Something similar will to happen if you need this to work across multiple pages.

    You've learned a lot since you first started posting :smile:

    Kevin

  • MelodyNelsonMelodyNelson Posts: 213Questions: 33Answers: 2
    edited September 13

    Another option to eliminate duplicated ids is to use HTML5 data-* attributes instead. In the click event use jQuery closest() to get the table which will be used as part of the toggle() selector to limit the elements to find to just that table.

    Yes ! That's the perfect idea I wish I had ! I'm never working with HTML5 data.
    I can't wait to try it live.
    Thanks Kevin

    BTW, Thanks for the simplified test case. Its much easier to help

    Thanks, I'm trying to be a better « student » :smiley:

    I have questions to undertsand how this is working (for me, it's like a magician is doing something I can't see).
    How does DT know what tables target with this code ?
    How do you change the « settings » if the tables are not the same ?
    How do it get the right data for each table when using orthogonal data ?

    var tables = new DataTable('table', {
      // tables options & settings
    })
    

    I give you some context to help understand my questionning...

    On the live page, I have 2 « model » of tables :
    - one displaying 10 years of informations (the one using the toggle on the rowgroup)

    - another one displaying the latest year informations

    Each « model » of DT is used for one company.
    There are 4 companys (for now), so there are 8 DT in the page with different datas.

    Before you show me var tables = new DataTable('table', {...}), this is how I have write my code and trying to not duplicate things.

    Creating variables with the maximum of things I could re-use for each table.
    For example the columns for the table with 10 years of infos :

    var columns_10ans = [
        { data: 'mois',
            render: function ( data, type, row ) {
                return DateTime.local(selectYear, data, 1).monthLong;
            }
         },
        { data: selectYear-10+'.reel', defaultContent: '0' },
        { data: selectYear-9+'.reel', defaultContent: '0' },
        { data: selectYear-8+'.reel', defaultContent: '0' },
        { data: selectYear-7+'.reel', defaultContent: '0' },
        { data: selectYear-6+'.reel', defaultContent: '0' },
        { data: selectYear-5+'.reel', defaultContent: '0' },
        { data: selectYear-4+'.reel', defaultContent: '0' },
        { data: selectYear-3+'.reel', defaultContent: '0' },
        { data: selectYear-2+'.reel', defaultContent: '0' },
        { data: selectYear-1+'.reel', defaultContent: '0' },
        { data: selectYear+'.reel', defaultContent: '0' },
    ];
    

    And then, for each table writing the minimum. The only thing changing for each DT is the « dataset » and the ID of the HTML table.

    // TABLE 10 YEARS COMPANY 1
    var table10ans_BCF = new DataTable('#tableau10ans_BCF', {
        data: dataSet_10ansBCF,
        language: myLanguage,
        ordering: false,
        pageLength: -1,
        caption: '',
        layout: layout_tables,
        columns: columns_10ans, 
        columnDefs: columnDefs_10ans,
        createdRow: createdRow_10ans,
        rowGroup: rowGroup_10ans,
        footerCallback: footerCallback_10ans,
    }) ;
    
    // TABLE 10 YEARS COMPANY 2
    var table10ans_JETFR = new DataTable('#tableau10ans_JETFR', {
        data: dataSet_10ansJETFR, 
        language: myLanguage,
        ordering: false,
        pageLength: -1,
        caption: '',
        layout: layout_tables,
        columns: columns_10ans, 
        columnDefs: columnDefs_10ans,
        createdRow: createdRow_10ans,
        rowGroup: rowGroup_10ans,
        footerCallback: footerCallback_10ans,
    }) ;
    
    // TABLE 10 YEARS COMPANY 3
    ...
    // TABLE 10 YEARS COMPANY 4
    ...
    
    // TABLE LAST YEAR COMPANY 1
    var tableRecapAnnee_BCF = new DataTable('#tableau_annee_BCF', {
        data: dataSet_lastAnneeBCF,
        language: myLanguage,
        ordering: false,
        pageLength: -1,
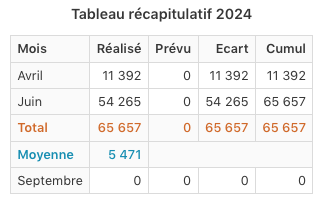
        caption: '<span class="has-text-weight-semibold font90rem">Tableau récapitulatif $4DTEXT(WEB_vt_anneeFin)</span>',
        layout: layout_tables,
        columns: columns_recapAnnee,
        columnDefs: columnDefs_recapAnnee,
        footerCallback: footerCallback_recapAnnee,
    });
    
    // TABLE LAST YEAR COMPANY 2
    ...
    // TABLE LAST YEAR COMPANY 3
    ...
    // TABLE LAST YEAR COMPANY 4
    ...
    

    Can I replicate this kind of working with var tables = new DataTable('table', {...}) ?

    Sorry for the long post, I hope it's clear...

  • MelodyNelsonMelodyNelson Posts: 213Questions: 33Answers: 2
    edited September 13

    Using Jquery UI toggle() is a clever solution. I don't think you have this issue because I think all your data is on one page but the toggle only works on the page displayed. There are other solutions on the forum that keep track of the collapsed groups using a variable. Something similar will to happen if you need this to work across multiple pages.

    Thank you. You're right everything is on the same page but I keep the post bookmarked in case I need to use the other solution.

    You've learned a lot since you first started posting :smile:

    Thanks, I'm blushing a little but taking the compliment for my JS ego :smiley:

  • kthorngrenkthorngren Posts: 21,336Questions: 26Answers: 4,951
    edited September 13

    How does DT know what tables target with this code ?

    The 'table' is a jQuery selector that will find all table elements on the page. You could make this more targeted by adding a classname to the selector, for example: 'table.datatable'.

    How do you change the « settings » if the tables are not the same ?

    You can set Default Settings once on the page to apply to all the Datatables. Each Datatable you define any specific configurations either overriding the defaults or adding to them.

    You might be able to do something like this:

    $.extend( $.fn.dataTable.defaults, {
        language: myLanguage,
        ordering: false,
        pageLength: -1,
        caption: '',
        layout: layout_tables,
        columns: columns_10ans,
        columnDefs: columnDefs_10ans,
        createdRow: createdRow_10ans,
        rowGroup: rowGroup_10ans,
        footerCallback: footerCallback_10ans,
    } );
    
    // TABLE 10 YEARS COMPANY 1
    var table10ans_BCF = new DataTable('#tableau10ans_BCF', {
        data: dataSet_10ansBCF,
    }) ;
     
    // TABLE 10 YEARS COMPANY 2
    var table10ans_JETFR = new DataTable('#tableau10ans_JETFR', {
        data: dataSet_10ansJETFR,
    }) ;
    
    // TABLE LAST YEAR COMPANY 1
    var tableRecapAnnee_BCF = new DataTable('#tableau_annee_BCF', {
        data: dataSet_lastAnneeBCF,
        caption: '<span class="has-text-weight-semibold font90rem">Tableau récapitulatif $4DTEXT(WEB_vt_anneeFin)</span>',
        columns: columns_recapAnnee,
        columnDefs: columnDefs_recapAnnee,
        footerCallback: footerCallback_recapAnnee,
        createdRow: function (row, data, dataIndex) { },
        rowGroup: {
          enable: false
        }
    });
    

    For that last table use an empty createdRow function and set rowGroup.enable to false to override the default settings and do nothing. Here is a simple example:
    https://live.datatables.net/pesocoze/1/edit

    Kevin

  • MelodyNelsonMelodyNelson Posts: 213Questions: 33Answers: 2
    edited September 13

    Thanks for the explanations and advices.
    I need to update my page now with all of that !

    I already have this defaults setting in a JS file loaded on every page.
    Will it works combine with the one you suggested to add without conflict (with the word « extend », I imagine it's like a complement to the existing default settings) ?

    The existing default settings for all the website pages :

    Object.assign(DataTable.defaults, {
        lengthMenu: [5, 10, 25, 50, 100, { label: 'Tout', value: -1 }],
        pageLength: 25,
        caption: '<span class="font85rem has-text-grey">Cliquer sur la ligne ou sur le <span class="mx-1">&#9654;</span> pour afficher des informations complémentaires</span>',
        processing: true,
        layout: {
            topStart: 'pageLength',
            topEnd: {
                search: {
                    text: '_INPUT_',
                    placeholder: 'Rechercher dans la liste'
                }
            },
            bottomStart: 'info',
            bottomEnd: 'paging'
        },
        initComplete: function () {
            $('div.dtsp-panesContainer button').addClass('is-small');
        }
    });
    

    If I want to combine the settings with the case we've seen before (toggle rows), can I write this ?

    var tables = new DataTable('table.myClass', {
      pageLength: -1,
      createdRow: function( row, data, dataIndex ) {  
        $(row).attr('style', 'display:none;');
        $(row).addClass( 'child trimestre' + data[2] );
        $(row).data('group-id', 'trimestre' + data[2] + '_mois' + dataIndex);
      },
      order: [[2, 'asc']],
      rowGroup: {
            startClassName: 'trimestre hasChild',
            startRender: function (rows, group) {         
              return $('<tr data-group-id="trimestre' + group + '" />')
                .append('<td colspan="5"><strong>' + group +'</strong></td>')
                .append('<td>' + rows.count() + '</td>') ;
            },
            dataSrc: 2
        }
    // add all the settings needed here
    // in this case, I don't need to use $.extend( $.fn.dataTable.defaults) if there is conflict
    });
    

    And after « declare » the DT with their ID and « dataset »?
    The tables won't be created a second time ?

    // TABLE 10 YEARS COMPANY 1
    var table10ans_BCF = new DataTable('#tableau10ans_BCF', {
        data: dataSet_10ansBCF,
    }) ;
      
    // TABLE 10 YEARS COMPANY 2
    var table10ans_JETFR = new DataTable('#tableau10ans_JETFR', {
        data: dataSet_10ansJETFR,
    }) ;
    
  • kthorngrenkthorngren Posts: 21,336Questions: 26Answers: 4,951
    edited September 13

    The tables won't be created a second time ?

    If you initialize some tables with new DataTable('table.myClass', { then use new DataTable('#tableau10ans_BCF', { and #tableau10ans_BCF was already initialized with the selector table.myClass you will get the Cannot reinitialise DataTable error. You can initialize a Datatable only once.

    Not sure if I answered your question.

    Kevin

  • MelodyNelsonMelodyNelson Posts: 213Questions: 33Answers: 2

    Mmmm, I think you answered but I need to try it to be sure.
    I will come back after and show you the code so it will be more concrete.

  • MelodyNelsonMelodyNelson Posts: 213Questions: 33Answers: 2
    edited September 13

    Thanks Kevin.
    This is the code WORKING (capitals are sometimes needed !) with all your recommandations. That's really nice to have something I can easily read and change.

    // REGLAGES PAR DÉFAUT POUR L'ENSEMBLE DES DT DE LA PAGE (BASÉ SUR REGLAGES DES TABLEAUX 10 ANS)
    // lors des déclarations des tables de la dernière année il faut ajouter createdRow vide + rowGroup false
    $.extend( $.fn.dataTable.defaults, {
        language: myLanguage,
        ordering: false,
        pageLength: -1,
        caption: '',
        layout: layout_tables,
        columns: columns_10ans,
        columnDefs: columnDefs_10ans,
        createdRow: createdRow_10ans,
        rowGroup: rowGroup_10ans,
        footerCallback: footerCallback_10ans,
    } );
        
    // TABLE 10 YEARS COMPANY 1
    var table10ans_BCF = new DataTable('#tableau10ans_BCF', {
        data: dataSet_10ansBCF
    });
    
    // TABLE 10 YEARS COMPANY 2
    var table10ans_JETFR = new DataTable('#tableau10ans_JETFR', {
        data: dataSet_10ansJETFR
    });
    
    // TABLE 10 YEARS COMPANY 3
    var table10ans_JETCH = new DataTable('#tableau10ans_JETCH', {
        data: dataSet_10ansJETCH
    });
    
    // TABLE 10 YEARS COMPANY 4
    var table10ans_TMTL = new DataTable('#tableau10ans_TMTL', {
        data: dataSet_10ansTMTL
    });
    
    // AFFICHER | MASQUER LES LIGNES MENSUELLES LORS DU CLIC SUR LE TRIMESTRE
    $('table.dataTable')
        .on('click', 'tr.trimestre', function () {      
            var table = $(this).closest('table'); 
            var groupRow = $(this).closest('tr');
    
            // ex : le trimestre = <tr data-group-id="trimestre1" class="trimestre hasChild...">
            var rowID = $( groupRow ).data('group-id');
      
            // ex : les mois = <tr class="child trimestre1...">
            var child = '.child.' + rowID;
    
            $( child, table ).toggle(); 
    });
    
    // TABLE LAST YEAR COMPANY 1
    var tableRecapAnnee_BCF = new DataTable('#tableau_annee_BCF', {
        data: dataSet_lastAnneeBCF,
        caption: '<span class="has-text-weight-semibold font90rem">Tableau récapitulatif $4DTEXT(WEB_vt_anneeFin)</span>',
        columns: columns_recapAnnee,
        columnDefs: columnDefs_recapAnnee,
        footerCallback: footerCallback_recapAnnee,
        createdRow: function (row, data, dataIndex) { },
        rowGroup: {
            enable: false
        }
    });
    
    // TABLE LAST YEAR COMPANY 2
    var tableRecapAnnee_JETFR = new DataTable('#tableau_annee_JETFR', {
        data: dataSet_lastAnneeJETFR,
        caption: '<span class="has-text-weight-semibold font90rem">Tableau récapitulatif $4DTEXT(WEB_vt_anneeFin)</span>',
        columns: columns_recapAnnee,
        columnDefs: columnDefs_recapAnnee,
        footerCallback: footerCallback_recapAnnee,
        createdRow: function (row, data, dataIndex) { },
        rowGroup: {
          enable: false
        }
    });
    
    // TABLE LAST YEAR COMPANY 3
    var tableRecapAnnee_JETCH = new DataTable('#tableau_annee_JETCH', {
        data: dataSet_lastAnneeJETCH,
        caption: '<span class="has-text-weight-semibold font90rem">Tableau récapitulatif $4DTEXT(WEB_vt_anneeFin)</span>',
        columns: columns_recapAnnee,
        columnDefs: columnDefs_recapAnnee,
        footerCallback: footerCallback_recapAnnee,
        createdRow: function (row, data, dataIndex) { },
        rowGroup: {
            enable: false
        }
    });
    
    // TABLE LAST YEAR COMPANY 4
    var tableRecapAnnee_TMTL = new DataTable('#tableau_annee_TMTL', {
        data: dataSet_lastAnneeTMTL,
        caption: '<span class="has-text-weight-semibold font90rem">Tableau récapitulatif $4DTEXT(WEB_vt_anneeFin)</span>',
        columns: columns_recapAnnee,
        columnDefs: columnDefs_recapAnnee,
        footerCallback: footerCallback_recapAnnee,
        createdRow: function (row, data, dataIndex) { },
        rowGroup: {
            enable: false
        }
    });
    
  • kthorngrenkthorngren Posts: 21,336Questions: 26Answers: 4,951

    Very nice!!

    Kevin

  • MelodyNelsonMelodyNelson Posts: 213Questions: 33Answers: 2

    Thanks again for your help :)

  • MelodyNelsonMelodyNelson Posts: 213Questions: 33Answers: 2

    Yesterday, I went back to another topic concerning the same page about creating series for a chart for each table and try your suggestion : creating the charts on initComplete and it works !

    See your latest posts in this discussion :
    https://datatables.net/forums/discussion/79756/create-a-serie-for-a-chart-with-the-values-of-the-row-grouping#latest

    But I have a problem (again...), I don't know how to empy the series between each table.
    I think I should clear the series somewhere because they are good for the first table, but cumulate on the next tables (see the screens captures below)

    This is how I did it

    1) Add this global var before the JS datatables

    var seriesChart10years = [];
    

    2) Add the series for the chart in the rowgrouping code

    var rowGroup_10ans = {
        dataSrc: ['trimestre'],
        startClassName: 'trimestre hasChild white-space-nowrap',
        startRender: function ( rows, group, level ) {
            
            // CALC TOTALS
            //... code to calculate all years totals
            
            // CREATING THE SERIES FOR THE CHART
            // seriesChart10years is a global VAR (created before DT)
        
            // clear the series before adding the groups totals
            // (THIS IS NOT WORKING)
            var serie1 = {};
            var serie2 = {};
            var serie3 = {};
            var serie4 = {};
            
            switch( group ) {
                case 1:
                    var serie1 = {
                        name: 'Trimestre ' + group,
                        data: [Year10_subtotal, Year9_subtotal, Year8_subtotal, Year7_subtotal, Year6_subtotal, Year5_subtotal, Year4_subtotal, Year3_subtotal, Year2_subtotal, Year1_subtotal, selectYear_subtotal] };
                        seriesChart10years.push(serie1);
                    break;
                case 2:
                    var serie2 = {
                        name: 'Trimestre ' + group,
                        data: [Year10_subtotal, Year9_subtotal, Year8_subtotal, Year7_subtotal, Year6_subtotal, Year5_subtotal, Year4_subtotal, Year3_subtotal, Year2_subtotal, Year1_subtotal, selectYear_subtotal] };
                        seriesChart10years.push(serie2);
                    break;
                case 3:
                    var serie3 = {
                        name: 'Trimestre ' + group,
                        data: [Year10_subtotal, Year9_subtotal, Year8_subtotal, Year7_subtotal, Year6_subtotal, Year5_subtotal, Year4_subtotal, Year3_subtotal, Year2_subtotal, Year1_subtotal, selectYear_subtotal] };
                        seriesChart10years.push(serie3);
                    break;
                case 4:
                    var serie4 = {
                        name: 'Trimestre ' + group,
                        data: [Year10_subtotal, Year9_subtotal, Year8_subtotal, Year7_subtotal, Year6_subtotal, Year5_subtotal, Year4_subtotal, Year3_subtotal, Year2_subtotal, Year1_subtotal, selectYear_subtotal] };
                        seriesChart10years.push(serie4);
                    break;
            }
    
        }
    };


    3) Add the chart with the series in the code of each table

    // TABLE 10 YEARS COMPANY 1
    var table10ans_BCF = new DataTable('#tableau10ans_BCF', {
        data: dataSet_10ansBCF, 
        initComplete: function (settings, json) {
    
            // CHART 10 YEARS COMPANY 1
            Highcharts.chart('graphe_10ans_BCF', {  
                title: {
                    text: titre10ans_BCF,
                },
                xAxis: {
                    categories: categories10ans,
                },
                tooltip: tooltip_trimestre,
                series: seriesChart10years
            });
        }
    });
    
    // TABLE 10 YEARS COMPANY 2
    var table10ans_JETFR = new DataTable('#tableau10ans_JETFR', {
        data: dataSet_10ansJETFR,
        initComplete: function (settings, json) {
            
            // CHART 10 YEARS COMPANY 2
            Highcharts.chart('graphe_10ans_JETFR', {    
                title: {
                    text: titre10ans_JETFR,
                },
                xAxis: {
                    categories: categories10ans,
                },
                tooltip: tooltip_trimestre,
                series: seriesChart10years
            });
        }
    });
    
    // TABLE 10 YEARS COMPANY 3 : SAME JS CODE
    
    // TABLE 10 YEARS COMPANY 4 : SAME JS CODE
    

    As you can see below, it's working almost well :D

    For the first table, its OK

    For the others, series of the previous tables are « cumulated »

    Sorry if I'm putting the code here but it's not easy to replicate all the page in a test case.

  • kthorngrenkthorngren Posts: 21,336Questions: 26Answers: 4,951
    edited September 14

    The easiest way is to set seriesChart10years to an empty array at the beginning of rowgroup start render. For example:

        startRender: function ( rows, group, level ) {
             
            // CALC TOTALS
            //... code to calculate all years totals
             
            // CREATING THE SERIES FOR THE CHART
            // seriesChart10years is a global VAR (created before DT)
         
            // clear the series before adding the groups totals
            // (THIS IS NOT WORKING)
            var serie1 = {};
            var serie2 = {};
            var serie3 = {};
            var serie4 = {};
            seriesChart10years = [];
    ....
    

    seriesChart10years will remain global setting it this way without var.

    This assumes that each Datatable is initialized one after the other. Meaning you aren't using jQuery ajax() to fetch the data for each Datatable which would be an asynchronous process initializing each Datatable.

    If you are doing something that causes asynchronous loading of the Datatables then we will need to find a different solution.

    Kevin

  • MelodyNelsonMelodyNelson Posts: 213Questions: 33Answers: 2
    edited September 14

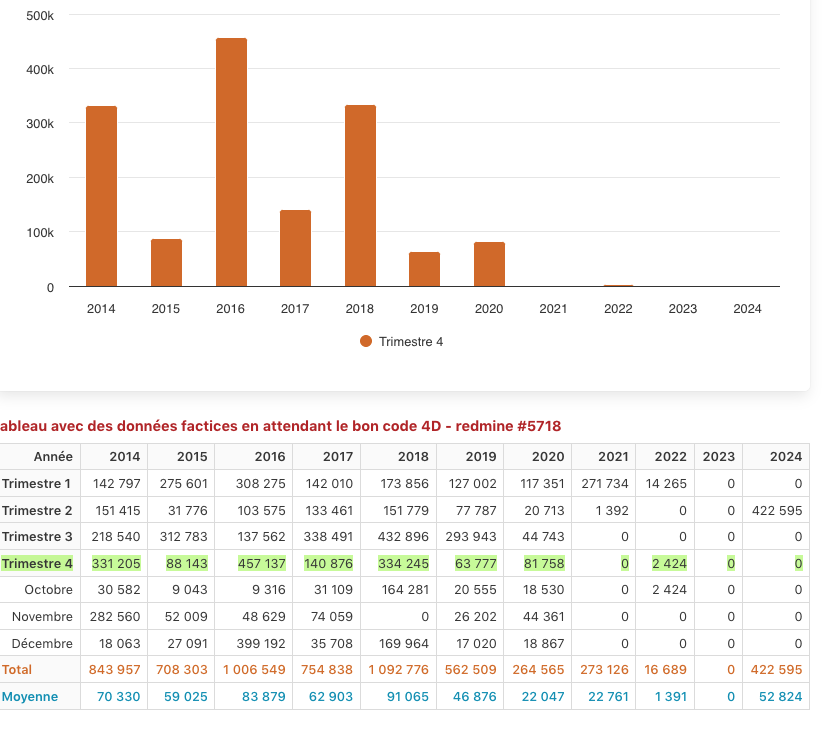
    I've changed the code to clear the series inside Rowgroup like you mentionned.

    It's strange, now I only see one group (trimestre) in each table.
    Another thing change (for good) : that's the good values for each table (no more « cumul » from table to table)

    Company 1
    Company 2
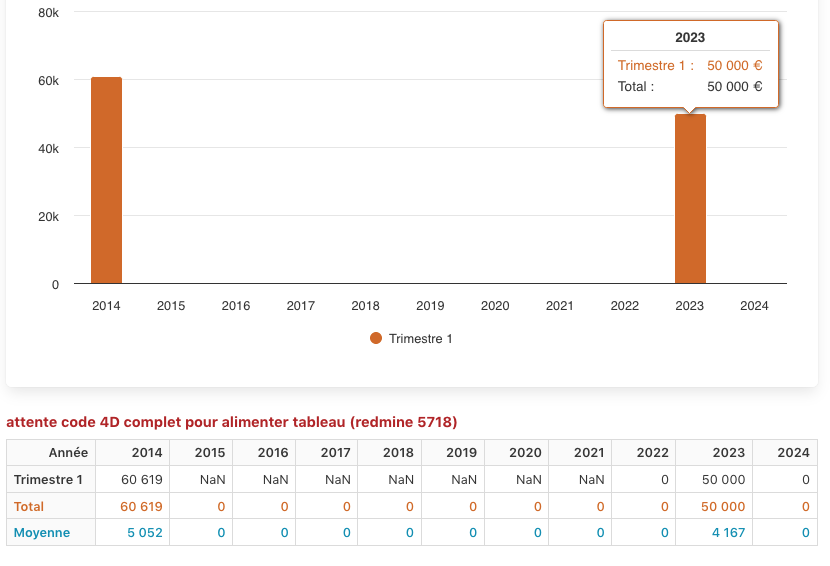
    I don't think the data for the tables is using an asynchronous process.
    At the beginning of the page, there is ORDA request to a database (not inside a JS script). The data is collected in an Array. Then, the array is affected to a JS var before the DT code. This is for example the var for the data of the Company 1.

    var dataSet_10ansBCF = <!--#4DHTML WEB_vt_dataBudgets10ans_bcf --> ;
    

    Don't pay attention to the syntax , it's a specificity (this word exist ?) of the 4D app.
    In this case, it's returning something like

    [
        {
            "mois": 1,
            "trimestre": 1,
            "2014": {
                "annee": 2014,
                "mois": 1,
                "reel": 7539,
                "trimestre": 1
            },
            "2015": {
                "annee": 2015,
                "mois": 1,
                "reel": 6154,
                "trimestre": 1
            },
               ...
    ]
    
  • kthorngrenkthorngren Posts: 21,336Questions: 26Answers: 4,951
    edited September 14

    Sounds like synchronous loading of the Datatables :smile:

    Sorry you don't want to add seriesChart10years = []; in rowGroup.startRender. Place it before the initialization code of each table, for example:

    seriesChart10years = [];
    // TABLE 10 YEARS COMPANY 1
    var table10ans_BCF = new DataTable('#tableau10ans_BCF', {
        data: dataSet_10ansBCF
    });
     
    seriesChart10years = [];
    // TABLE 10 YEARS COMPANY 2
    var table10ans_JETFR = new DataTable('#tableau10ans_JETFR', {
        data: dataSet_10ansJETFR
    });
    

    Kevin

  • MelodyNelsonMelodyNelson Posts: 213Questions: 33Answers: 2
    edited September 14

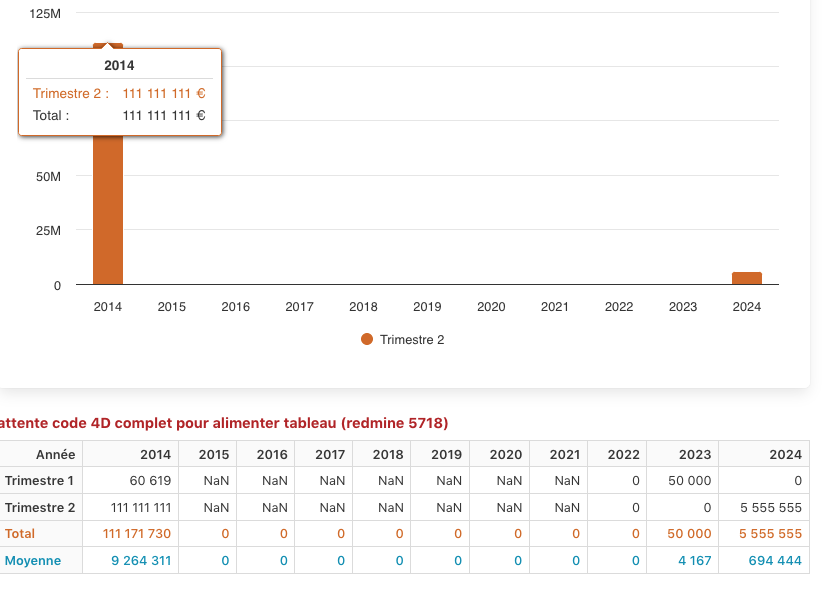
    EDIT : I've added more fake data to be sure about the series showing.
    For company 2, 3 and 4, only one serie is showing. I think it's always the last one.
    It seems logic if after adding seriesChart10years = []; in the StartEnder of RowGroup, no ?

    Company 2
  • kthorngrenkthorngren Posts: 21,336Questions: 26Answers: 4,951

    Did you see my previous comment to move seriesChart10years = [];?

    Kevin

  • MelodyNelsonMelodyNelson Posts: 213Questions: 33Answers: 2

    Sorry you don't want to add seriesChart10years = []; in rowGroup.startRender. Place it before the initialization code of each table, for example:

    I have deleted all these lines in startEnder (rowgroup)

    var serie1 = {};
            var serie2 = {};
            var serie3 = {};
            var serie4 = {};
            seriesChart10years = [];
    

    Also deleted at the beginning of the page

    var seriesChart10years = [];
    

    And now, it's only before each table

    // CLEAR CHARTS SERIES BEFORE TABLE
    seriesChart10years = [];
    
    // TABLEAU 10 ANS COMPANY 1
    var table10ans_BCF = new DataTable('#tableau10ans_BCF', {
        data: dataSet_10ansBCF,
        initComplete: function (settings, json) {
    
            // GRAPHE 10 ANS COMPANY 1  
            Highcharts.chart('graphe_10ans_BCF', {  
                title: {
                    text: titre10ans_BCF,
                },
                xAxis: {
                    categories: categories10ans,
                },
                tooltip: tooltip_trimestre,
                series: seriesChart10years
            });
        }
    });
    
    // CLEAR CHARTS SERIES BEFORE TABLE
    seriesChart10years = [];
    
    // TABLEAU 10 ANS COMPANY 2
    var table10ans_JETFR = new DataTable('#tableau10ans_JETFR', {
        data: dataSet_10ansJETFR, 
        initComplete: function (settings, json) {
            
            // GRAPHE 10 ANS COMPANY 1  
            Highcharts.chart('graphe_10ans_JETFR', {    
                title: {
                    text: titre10ans_JETFR,
                },
                xAxis: {
                    categories: categories10ans,
                },
                tooltip: tooltip_trimestre,
                series: seriesChart10years
            });
        }
    });
    
    // CLEAR CHARTS SERIES BEFORE TABLE
    seriesChart10years = [];
    
    // TABLE 3
    
    // CLEAR CHARTS SERIES BEFORE TABLE
    seriesChart10years = [];
    
    // TABLE 4
    

    DId I miss something ?

    The first chart is OK, the other ones are cumulating series

  • kthorngrenkthorngren Posts: 21,336Questions: 26Answers: 4,951

    I have deleted all these lines in startEnder (rowgroup)

    I meant to only delete seriesChart10years = []; from rowGroup.startRender. I believe you still need to clear the var serie1 = {}; variables for each group.

    Also deleted at the beginning of the page
    var seriesChart10years = [];

    Probably doesn't matter in your case but I would put it back so there is a global reference to that variable.

    Kevin

  • MelodyNelsonMelodyNelson Posts: 213Questions: 33Answers: 2
    edited September 15

    Ok, I think everything is in its right place now.

    That's all the JS code between <script> and </script>, I have put some « ... » on the parts we don't need here to try to reduce le volume of the post.
    (if I put this is the livedatatable tools, there is too many errors, it need adaptations)

    If I didn't make mistake, I don't understand what's happening.
    Could it be using $(document).ready?


    <script> /////////////////////// VARIABLES POUR LES DATES (LUXON) var today = DateTime.fromISO(DateTime.now()); var todayYear = today.year; var selectYear = <!--#4DHTML WEB_vt_anneeFin -->; /////////////////////// VARIABLES POUR LES GRAPHES // titres des graphes var titre10ans_BCF = 'COMPANY 1 ' + (selectYear-10) + ' à ' + selectYear ; var titre10ans_JETFR = 'COMPANY 2 ' + (selectYear-10) + ' à ' + selectYear ; var titre10ans_JETCH = 'COMPANY 3 ' + (selectYear-10) + ' à ' + selectYear ; var titre10ans_TMTL = 'COMPANY 4 ' + (selectYear-10) + ' à ' + selectYear ; // catégories var categories10ans = [selectYear-10, selectYear-9, selectYear-8, selectYear-7, selectYear-6, selectYear-5, selectYear-4, selectYear-3, selectYear-2, selectYear-1, selectYear]; // variable dans laquelle seront stockées les séries du graphe sur 10 ans // les séries sont alimentées dans RowGroup de DT (rowGroup_10ans) var seriesChart10years = []; /////////////////////// VARIABLES POUR LES DATATABLE // datasets des différents tableaux var dataSet_10ansBCF = <!--#4DHTML WEB_vt_dataBudgets10ans_bcf -->; var dataSet_lastAnneeBCF = <!--#4DHTML WEB_vt_dataBudgetsAnnee_bcf -->; var dataSet_10ansJETFR = <!--#4DHTML WEB_vt_dataBudgets10ans_jetfr -->; var dataSet_lastAnneeJETFR = <!--#4DHTML WEB_vt_dataBudgetsAnnee_jetfr -->; var dataSet_10ansJETCH = <!--#4DHTML WEB_vt_dataBudgets10ans_jetch -->; var dataSet_lastAnneeJETCH = <!--#4DHTML WEB_vt_dataBudgetsAnnee_jetch -->; var dataSet_10ansTMTL = <!--#4DHTML WEB_vt_dataBudgets10ans_tmtl -->; var dataSet_lastAnneeTMTL = <!--#4DHTML WEB_vt_dataBudgetsAnnee_tmtl -->; // éléments réutilisées dans les différents tableaux var layout_tables = { ... }; var columns_10ans = [ ... ]; var columnDefs_10ans = [ ... ]; var columns_recapAnnee = [ ... ]; var columnDefs_recapAnnee = [ ... ]; var createdRow_10ans = function( row, data, dataIndex ) { ... }; var rowGroup_10ans = { dataSrc: ['trimestre'], startClassName: 'trimestre hasChild white-space-nowrap', startRender: function ( rows, group, level ) { // TOTAUX TRIMESTRIELS var Year10_subtotal = rows .data() .pluck(selectYear-10+'.reel') .reduce(function (a, b) { return a + b * 1; }, 0) ; ... // CREATING THE SERIES FOR THE CHART // seriesChart10years is a global VAR (created before DT) // clear the series before adding the groups totals in each serie (THIS IS NOT WORKING) var serie1 = {}; var serie2 = {}; var serie3 = {}; var serie4 = {}; switch( group ) { case 1: var serie1 = { name: 'Trimestre ' + group, data: [Year10_subtotal, Year9_subtotal, Year8_subtotal, Year7_subtotal, Year6_subtotal, Year5_subtotal, Year4_subtotal, Year3_subtotal, Year2_subtotal, Year1_subtotal, selectYear_subtotal] }; seriesChart10years.push(serie1); break; case 2: var serie2 = { name: 'Trimestre ' + group, data: [Year10_subtotal, Year9_subtotal, Year8_subtotal, Year7_subtotal, Year6_subtotal, Year5_subtotal, Year4_subtotal, Year3_subtotal, Year2_subtotal, Year1_subtotal, selectYear_subtotal] }; seriesChart10years.push(serie2); break; case 3: var serie3 = { name: 'Trimestre ' + group, data: [Year10_subtotal, Year9_subtotal, Year8_subtotal, Year7_subtotal, Year6_subtotal, Year5_subtotal, Year4_subtotal, Year3_subtotal, Year2_subtotal, Year1_subtotal, selectYear_subtotal] }; seriesChart10years.push(serie3); break; case 4: var serie4 = { name: 'Trimestre ' + group, data: [Year10_subtotal, Year9_subtotal, Year8_subtotal, Year7_subtotal, Year6_subtotal, Year5_subtotal, Year4_subtotal, Year3_subtotal, Year2_subtotal, Year1_subtotal, selectYear_subtotal] }; seriesChart10years.push(serie4); break; } ... }; var footerCallback_10ans = function (row, data, start, end, display) { ... }; var footerCallback_recapAnnee = function (row, data, start, end, display) { ... }; $(document).ready(function() { // OPTIONS PAR DÉFAUT POUR TOUS LES GRAPHES Highcharts.setOptions({ ... }); // contenu du tooltip dans le graphe 10 ans var tooltip_trimestre = { ... }; // REGLAGES PAR DÉFAUT POUR L'ENSEMBLE DES DATATABLE DE LA PAGE (BASÉ SUR REGLAGES DES TABLEAUX 10 ANS) // lors des déclarations des tables de la dernière année il faut ajouter createdRow vide + rowGroup false $.extend( $.fn.dataTable.defaults, { ... } ); // CLEAR CHARTS SERIES BEFORE TABLE seriesChart10years = []; // TABLE 1 var table10ans_BCF = new DataTable('#tableau10ans_BCF', { data: dataSet_10ansBCF, initComplete: function (settings, json) { // CHART 1 Highcharts.chart('graphe_10ans_BCF', { title: { text: titre10ans_BCF, }, xAxis: { categories: categories10ans, }, tooltip: tooltip_trimestre, series: seriesChart10years }); } }); // CLEAR CHARTS SERIES BEFORE TABLE seriesChart10years = []; // TABLE 2 var table10ans_JETFR = new DataTable('#tableau10ans_JETFR', { data: dataSet_10ansJETFR, initComplete: function (settings, json) { // CHART 2 Highcharts.chart('graphe_10ans_JETFR', { title: { text: titre10ans_JETFR, }, xAxis: { categories: categories10ans, }, tooltip: tooltip_trimestre, series: seriesChart10years }); } }); // CLEAR CHARTS SERIES BEFORE TABLE seriesChart10years = []; // TABLE 3 var table10ans_JETCH = new DataTable('#tableau10ans_JETCH', { data: dataSet_10ansJETCH, initComplete: function (settings, json) { // CHART 3 Highcharts.chart('graphe_10ans_JETCH', { title: { text: titre10ans_JETCH, }, xAxis: { categories: categories10ans, }, tooltip: tooltip_trimestre, series: seriesChart10years }); } }); // CLEAR CHARTS SERIES BEFORE TABLE seriesChart10years = []; // TABLE 4 var table10ans_TMTL = new DataTable('#tableau10ans_TMTL', { data: dataSet_10ansTMTL, initComplete: function (settings, json) { // CHART 4 Highcharts.chart('graphe_10ans_TMTL', { title: { text: titre10ans_TMTL, }, xAxis: { categories: categories10ans, }, tooltip: tooltip_trimestre, series: seriesChart10years }); } }); // AFFICHER | MASQUER LES LIGNES MENSUELLES LORS DU CLIC SUR LE TRIMESTRE $('table.dataTable') .on('click', 'tr.trimestre', function () { var table = $(this).closest('table'); var groupRow = $(this).closest('tr'); // ex : le trimestre = <tr data-group-id="trimestre1" class="trimestre hasChild..."> var rowID = $( groupRow ).data('group-id'); // ex : les mois = <tr class="child trimestre1..."> var child = '.child.' + rowID; $( child, table ).toggle(); }); ... // end document ready }); </script>
  • MelodyNelsonMelodyNelson Posts: 213Questions: 33Answers: 2

    I found it : I put seriesChart10years = []; only in the init- footerCallback and all the charts are ok now.

  • MelodyNelsonMelodyNelson Posts: 213Questions: 33Answers: 2

    Thanks again for your help.

Sign In or Register to comment.