How do I re-arrange table data?
How do I re-arrange table data?
Description of problem:
I have a table that is produced using data echoed from a PHP backend. The table currently shows all the data returned from the server and displays it in the format it comes in. I'd like to limit which columns it displays (I was able to accomplish this already), re-arrange the data, and assign row names to the table. This is my first time doing a lot of this work but I'm trying to learn. If there's a better method for showing you my code, please let me know. I'd like to make this as easy as possible for you guys to help me. I can provide screenshots, code, or files.
Here's my jQuery to produce the table:
$(function sendYearMonthToServer() {
    $("span").click(function(event) {
        let $target = $(event.target);
        let month = ($target.closest("span").html()).substring(5,7);
        let year = ($target.closest("span").html()).substring(0,4);
        let queryString = window.location.search;
        let urlParams = new URLSearchParams(queryString);
        let term = urlParams.get('rptType');
        let monthYearTermArray = [month,year,term];
        let myJSON = JSON.stringify(monthYearTermArray);

        $("#clickedTable").dataTable({
            "paging": false,
            "ordering": false,
            "info": false,
            "searching": false,
            "ajax": {
                "url": "monthlyProductionReports_backend.php",
                "type": "POST",
                "data": {"monthYearTerm": monthYearTermArray}},
            "columns": [
                { "data": "RptKey"},
                { "data": "RptTypeKey"},
                { "data": "SumItemTypeKey"},
                { "data": "MthlyTot"},
                { "data": "YearToDateTot"},
                { "data": "CumTot"},
                { "data": "ActiveWells"}
            ]
        });
    });
});
Here's the PHP code that gets the data from our SQL Server:
<?php
    include 'oilgas/includes/MSSQLTestServerConnection.php';

    if (empty($_POST["monthYearTerm"])) {
        echo "Nothing was entered in the input field";
    } else {
        $month['startMonth'] = $_POST["monthYearTerm"][0];
        $year['startYear'] = $_POST["monthYearTerm"][1];
        $term['rptType'] = $_POST["monthYearTerm"][2];
    }

    // Parameters passed into SQL SP.
    $sql = "EXEC dbo.spOG_GetMonthlyProductionReports @startMonth = ?, @startYear = ?, @rptType = ?";
    $params = array(
        array($month['startMonth'], SQLSRV_PARAM_IN),
        array($year['startYear'], SQLSRV_PARAM_IN),
        array($term['rptType'], SQLSRV_PARAM_IN)
    );
    $stmt = sqlsrv_prepare($conn, $sql, $params);

    // Check if any errors occur during the preparation and execution of the SQL.
    if ($stmt === false) {
        echo "Statement Error"."<br>";
        PrintErrors();
    } elseif ( sqlsrv_execute( $stmt ) === false ) {
        echo "Execution Error"."<br>";
        PrintErrors();
    } else {
        while($row = sqlsrv_fetch_array($stmt, SQLSRV_FETCH_BOTH)) {
            $dataArray['data'][] = array(
                "RptKey" => (string)$row['RptKey'],
                "RptTypeKey" => (string)$row['RptTypeKey'],
                "SumItemTypeKey" => (string)$row['SumItemTypeKey'],
                "MthlyTot" => (string)$row['MthlyTot'],
                "YearToDateTot" => (string)$row['YearToDateTot'],
                "CumTot" => (string)$row['CumTot'],
                "ActiveWells" => (string)$row['ActiveWells']
            );
        }
        $jsonData = json_encode($dataArray, JSON_PRETTY_PRINT);
        // echo "<pre>$jsonData</pre>";
        echo $jsonData;
    }

<?php
>
```
?>


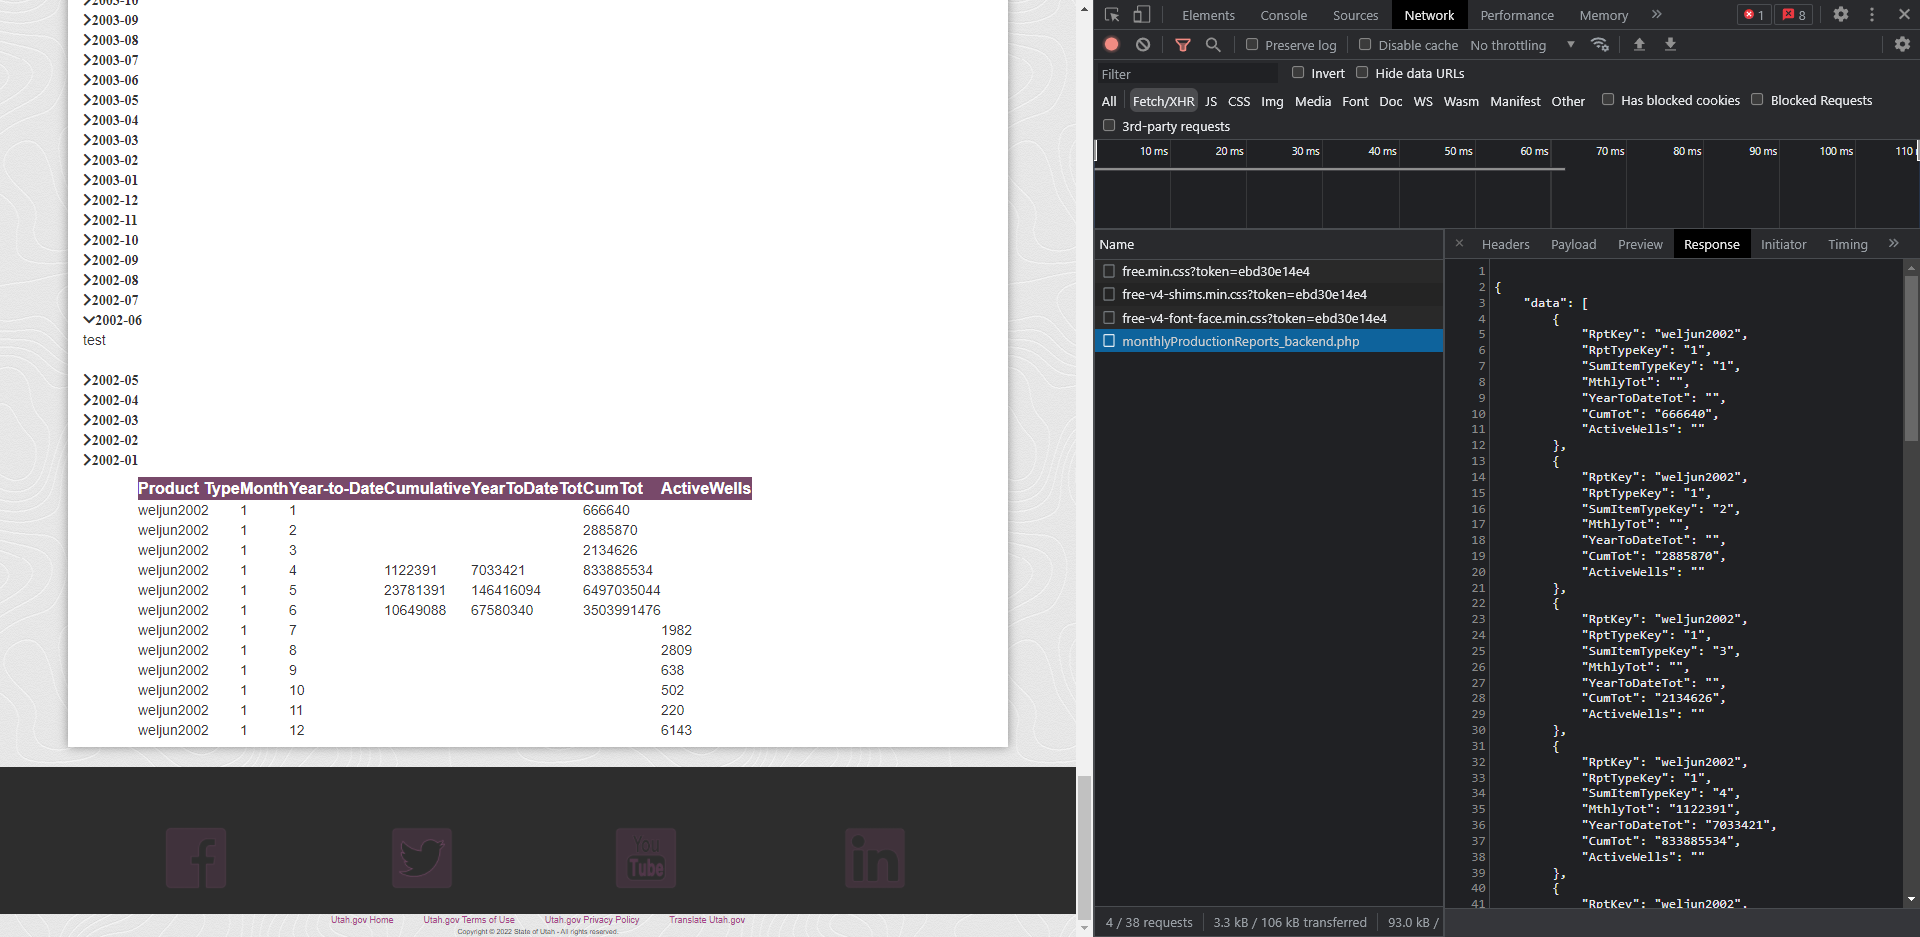
Here's the table I've been able to produce so far:
| Product Type | Month | Year-to-Date | Cumulative | YearToDateTot | CumTot | ActiveWells |
|---|---|---|---|---|---|---|
| weljun2002 | 1 | 1 | 666640 | |||
| weljun2002 | 1 | 2 | 2885870 | |||
| weljun2002 | 1 | 3 | 2134626 | |||
| weljun2002 | 1 | 4 | 1122391 | 7033421 | 833885534 | |
| weljun2002 | 1 | 5 | 23781391 | 146416094 | 6497035044 | |
| weljun2002 | 1 | 6 | 10649088 | 67580340 | 3503991476 | |
| weljun2002 | 1 | 7 | 1982 | |||
| weljun2002 | 1 | 8 | 2809 | |||
| weljun2002 | 1 | 9 | 638 | |||
| weljun2002 | 1 | 10 | 502 | |||
| weljun2002 | 1 | 11 | 220 | |||
| weljun2002 | 1 | 12 | 6143 |
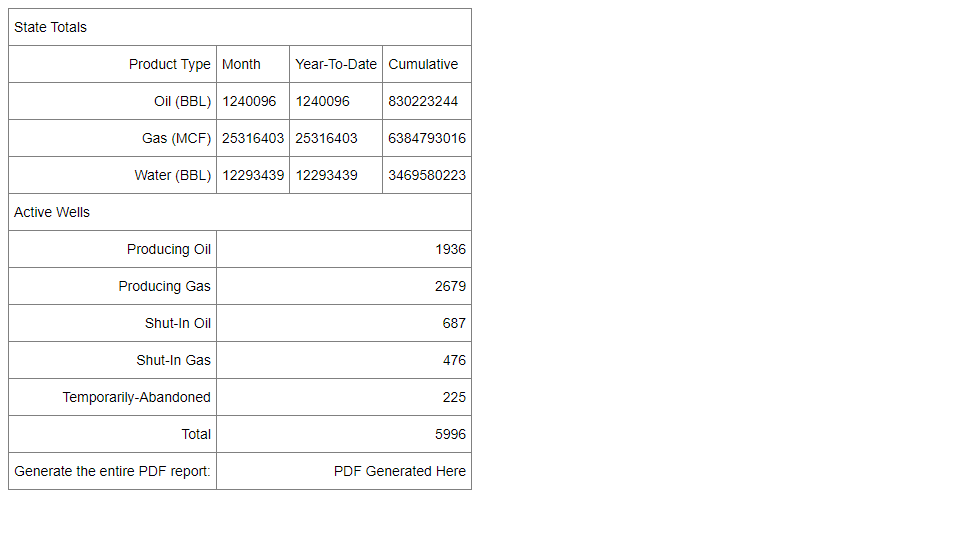
Here's what I would like to produce:
| State Totals | |||
|---|---|---|---|
| Product Type | Month | Year-To-Date | Cumulative |
| Oil (BBL) | 1240096 | 1240096 | 830223244 |
| Gas (MCF) | 25316403 | 25316403 | 6384793016 |
| Water (BBL) | 12293439 | 12293439 | 3469580223 |
| Active Wells | |||
| Producing Oil | 1936 | ||
| Producing Gas | 2679 | ||
| Shut-In Oil | 687 | ||
| Shut-In Gas | 476 | ||
| Temporarily-Abandoned | 225 | ||
| Total | 5996 | ||
| Generate the entire PDF report: | PDF Generated Here | ||
```
Here's a screenshot showing my current table and the data that's being passed to the table.

This is what I'd like to display:

This question has an accepted answers - jump to answer
Answers
We'll need some more information to help, such as how will you limit the columns? Is that using
columns.visible? Likewise, how do you mean re-arrange the data and assign row names?We're happy to take a look, but as per the forum rules, please link to a test case - a test case that replicates the issue will ensure you'll get a quick and accurate response. Information on how to create a test case (if you aren't able to link to the page you are working on) is available here.
Cheers,
Colin
I can limit which columns are displayed by not listed them in the ajax call. For example, if I didn't want to show the "RptKey", I could comment it out in the ajax call.
I'll see if I can put together a JSFiddle. Did you see the two images I attached? The first is the current table I'm able to produce, the second is the table I'd like to have. You'll notice the second table has row names on the left (Producing Oil, Producing Gas, etc.) while the first one doesn't. There are quite a few differences between the two tables.
You can have
colspanandrowspanin thethead. See this example for the details.Datatables doesn't support
colspanandrowspanin thetbody. See the HTML requirements docs. The RowGroup extension might do some of what you want. But Datatables doesn't support different numbers of displayed columns in the rows.Kevin
I think I almost got it working while I was putting together the jsfiddle. I'm going to make a new post with a much more simple example case of the problem I was running into.
@kthorngren Thanks. After some trial and error, I was suspecting that the dataTables didn't support colspan and rowspan in the tbody.