How to combine two tables? or interact with another subset of data
How to combine two tables? or interact with another subset of data
Link to test case: http://live.datatables.net/qigurada/1/
Description: Two data subsets recipient data and services data, recipients are subscribed to 1:n services
In my recipient array object I have recipient data and a key containing a list of services they are subscribed to, i.e.
let rcpObj = [
  {
    "id": "13251436",
    "cmOneID": "0",
    "email": "namesurname_uk@testemail.com",
    "name": "John G.",
    "jurisdiction": "SCPB - LON",
    "blackList": "0",
    "rm": "Domenica Zampatti",
    "lawfulBasis": "3",
    "subscriptions": ""
  },
  {
    "id": "13241506",
    "cmOneID": "298965407",
    "email": "jca62856@testemail.com",
    "name": "Michael S.",
    "jurisdiction": "SwissShared",
    "blackList": "0",
    "rm": "Domenica Zampatti",
    "lawfulBasis": "3",
    "subscriptions": "18474400,18404622"
  }];

let services = [
{"id":"18404622","name":"SVC38","label":"CH  > All Audiences >  Content > Newsletter"},
{"id":"28953520","name":"SVC61","label":"No Newsletter Subscriptions"},
{"id":"18474400","name":"SVC_DO_CH","label":"Double optin service CH (Swiss)"},
{"id":"29168770","name":"SVC63","label":"SFOS > Content > Newsletter"}
];
What I need now, is render the list of existing services across and then for each recipient, show which ones they are subscribed to, as you can see in my recipient obj I have the list of subscriptions Ids and in the services object the list of all subscriptions, which will be used to display the labels. I've not seen a similar example or use case in the documents, any support is welcome, this is sort of my current obstacle now,
Expected outcome:
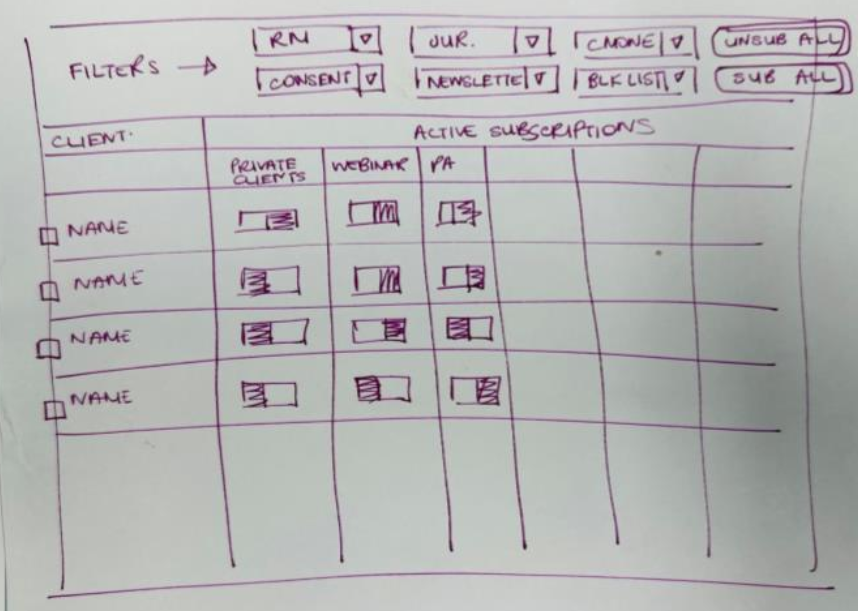
This question has accepted answers - jump to:
Answers
Sounds like you want a data structure that looks like this:
You can then use
columns.renderto display the array in the way you want.Likely the most efficient option would be to build a query of the data source that builds the rows the way you want. This may or may not be possible.
Otherwise you will need to combine the two arrays into a structure like above. Probably would be better to do this at the server script. If using
ajaxyou can useajax.dataSrcto combine the data with your choice of Javascript loops.Another option is to leave the
rcpObjarray as is and change theservicesarray to an object with the key being theid, for example:Then use
columns.renderto loop through all thesubscriptionsvalues to use as keys to pull the proper label(s) fromservices.You could display the service labels in child detail rows.
Kevin
Hi Thor,
But that way, if I have 50k recipient objects, the subscriptions will have to be copied to each object? isnt that too redundant?
I mean looking at it from a database perspective, thats copying the same data amogst 50 cells rather than referencing and making a link between the two.
Yep. I was just giving options since I don't know your environment, etc. If a service ID can be assigned to multiple people then yes this might be redundant. If a service ID is tied to only one person then maybe its not redundant.
EDIT: Note with this solution the
servicesarray would not be needed at the client. So maybe the redundancy would be ok. Its up to you to decide.Then convert the services array to an object like I described. Otherwise you will need to loop through the array look for each subscription ID.
Kevin
Hi Thor, I am still trying to get my head around this, and I guess the best way is to tackle it in smaller chunks.
I need to display all* the objects in the services array as columns, given that I need to be able to subscribe recipients to services they are not subscribed to.
For instance, this would be possible if can I dynamically inject new columns to datatables using one of its apis? i.e
and then loop for each item in myservice array then inject as column to
@allan it seems this is exactly what I need? is the API added to add new columns dinamically?
Datatables doesn't support this.
One option is to determine the number of columns required before initializing Datatables. Build the columns in a variable then using a variable that is used for initialization. See this generic example to show what I mean:
http://live.datatables.net/huyexejo/1/edit
Then you would need to create the code for each services column to extract the appropriate data from the services array. Can be done but would be a bit complex.
Maybe a better option is to use Child Detail Rows. This allows you to display data in the format you need using the format() function. This is freeform data without the restrictions Datatables imposes.
Kevin
@kthorngren and If I create the following structure data, would it be possible? basically create an object and append recipient and services as arrays of objects? would that allow me to create the custom columns based on the 2nd services array.
I think my only option is to prepare the columns beforehand as is easier, given that I only need to display the firstname in the first column.
http://live.datatables.net/qigurada/9/
Is this more or less a good alternative @kthorngren ??
Sorry, I misunderstood. I thought you only want to show the services the person is assigned to. This is a good alternative to chow all of them.
You could use
columns.renderfor the services column and if the person is assigned the service then display the service id or name and if not assigned then leave the cell empty.Kevin
@kthorngren, so the idea is.
Given that I have in my recipient object the services they are registered to, i need to show all* available services from my services object, which from the looks of it will become my column data, and in each cell for each row, i need to create a button which shows if the the recipient is subscribed to that service or not by matching the service ids.
That sounds like it will work nicely.
Regarding the API to dynamically add / remove columns. My comment in the screenshot above hasn't stood the test of time! It hasn't been implemented and isn't yet on the cards. I would like to do that one day, but I've been working on other aspects of DataTables.
The columns array needs to be dynamically generated at initialisation time if you don't have a fixed column structure. That could be done by looping over your
servicesobject for example.Allan
Hi @allan and @kthorngren
I've configured my columns, now I need to create a logic to display a text if the data id matches the id inside the object so I can write "Subscribed" so here it is.
if I have the following column, I am essentially configuring my column to display the recipient's subscriptions data which is rendered as following
inside the subscription object, I have the ID of the particular service, I want to know compare the data values against this object's id value "id":"3218143" how can I achieve that?
http://live.datatables.net/qigurada/10/edit
Take a look at the
columns.renderdocs.In your second column you have this:
Take note of the order of the parameters in the
columns.renderdocs. The first is the cell data not meta. Alsometais the last parameter. To use themetaparameter you need to include the others in proper order, for example:Now that column should have the row index. My guess is it is showing
undefined.The same goes for the subscriptions column, you have
metaandrowin the wrong order.The
columns.renderrowparameter contains the data for the full row. In the function you can access theidwithrow.id.Kevin
Hi @kthorngren
I need to be able to access the service column's defaultContent or id rather than the subscription's object id. from the screenshow below, I want to access the data highlighted in yellow.
latest edit
http://live.datatables.net/qigurada/12/edit
from the below, how can I access the title of the column or the id. or the default content so that I can compare if the subscription data ids match the columns's service id or defaultcontent or, I want to return the title.
as row.id returns my recipient's id.

There isn't an API method to get the
defaultContentfor a cell I'm afraid. It might still be possible, but I'm not seeing where in your code you are attempting to work with those values. There isn't an event handler that is attempting to work with those values? Unless I'm missing something? Do you want it in your rendering function?Allan
Hi @allan,
I think is slighly confusing given that I've used a workaround to get the outcome I want.
So, the object which contains recipient subscription data is the following
And here is one of my pre-configured configured column(s) aka service(s) which has the service ID (3218143) that I need to match with the recipient subscriptions service ids array "subscriptions": "3218140,3218140"
So currently, this return row.id is actually returning the id of the recipient object, obviously as the data key is subscriptions, however, I need to grab is my custom column id (3218143) so that I can compare it with the row.subscriptions data.
This won't be applied to the column data as Datatables doesn't have a
idoption forcolumns.One option might be what I suggested earlier:
I'm not sure what exactly you need to check but you can then use the
subscriptionsarray to access the object above by the id.Kevin
Hi @kthorngren what I need is to compare if the recipient's subscriptions ids, match the column service id. so that I can return "Yes" or "Subscribed" to that columns service.
I think this is what you are after:
http://live.datatables.net/qigurada/15/edit
It sets the
columns.datafor each subscription column to the subscription ID. Setscolumns.defaultContentto an empty string.initCompleteis used to iterate all the rows. In the loop it gets all the subscriptions into a list and loops the list to set all the appropriate columns withSubscribed.Finally uses
rows().invalidate()to have Datatables refresh its data cache with the updated data.Kevin
This is amazing, I want to thank you for all your support, we are getting ever so close to the desired outlook.
I've added the toggle buttons (checkbox) in turn of subscribed text, and I am trying to display the off buttons for those that are not, but doesnt seem to want to work, im trying to expand on your script.
http://live.datatables.net/dalavuni/1/edit
I then tried to add it in render but that seems to overwrite the subscriptions
Here is how I think I would be tempted to do it: http://live.datatables.net/dalavuni/3/edit . Use a rendering function to check what state the row's data is in and then return the result as needed.
Allan
The
if(subscriptions[i].length<1)will never be true because the loop won't be entered when it were true. Try moving the off position tocolumns.defaultContent.Kevin
Thanks @allan @kthor
I am trying now to create an array for all selected rows which list which checkboxes are checked and which are not. I got as far as having an array of selected rows ids using pluck, now I want for each selected row, an array/object of which checkedboxes are on/off. (the purpose for this is that, I need to process which subscriptions to register and which to deregister).
Issues: I added a button to execute the function to return selected rows recipient ids and it removes the filters, how do i have a button below the filters? I think this is because in the table config I changed the dom value to Bfrtip, but if I use Pfrtip it shows the filters but not the button.
http://live.datatables.net/zimerisa/2/edit
I didn't see Allan's solution until now. Its a good one
Combine all the letters in the order you want displayed,
dom: 'PBfrtip',for example.One option is to use
rows().every()to loop through the selected rows. In the loop userow().node()to get the HTMl node of the row. Using jQuery you can loop through all the checked checkboxes within thenode. For example:http://live.datatables.net/zimerisa/4/edit
Kevin
@allan @kthorngren
Im now intergating the script from the sandbox into my application and ran into some obstacle, given that I am programatically fetching the services then looping through them and pushing them to my colsDef array, it seems the function which renders the return content is causing some issues.
Here is the console log screenshot
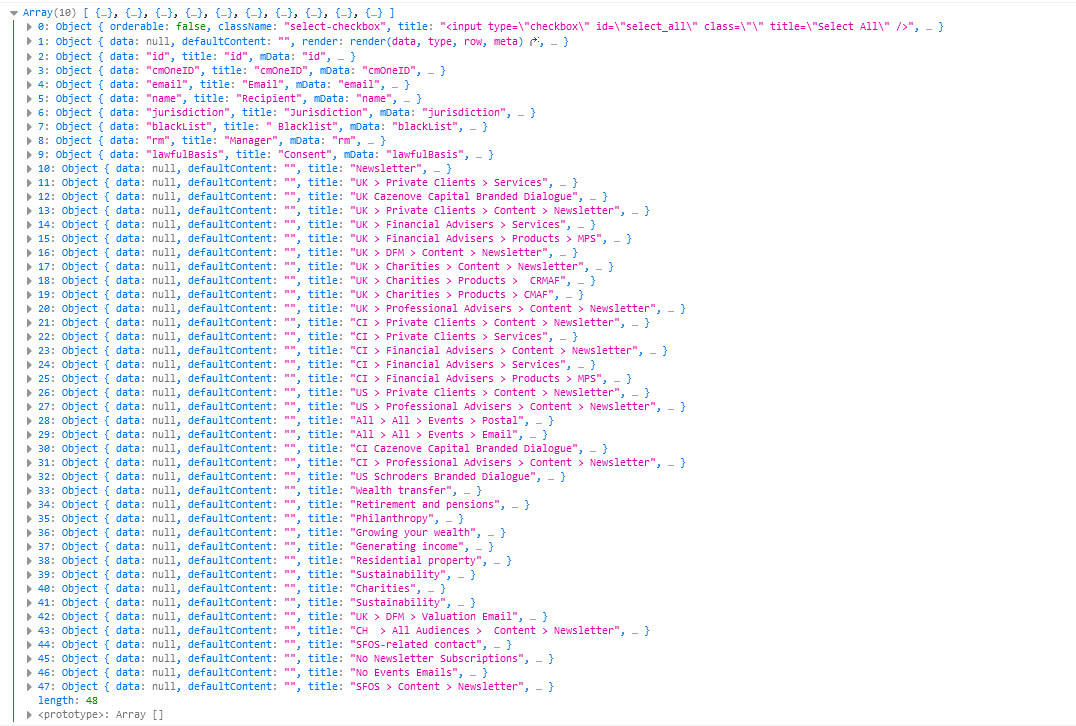
and here is the contents of the first service

Here is the error message
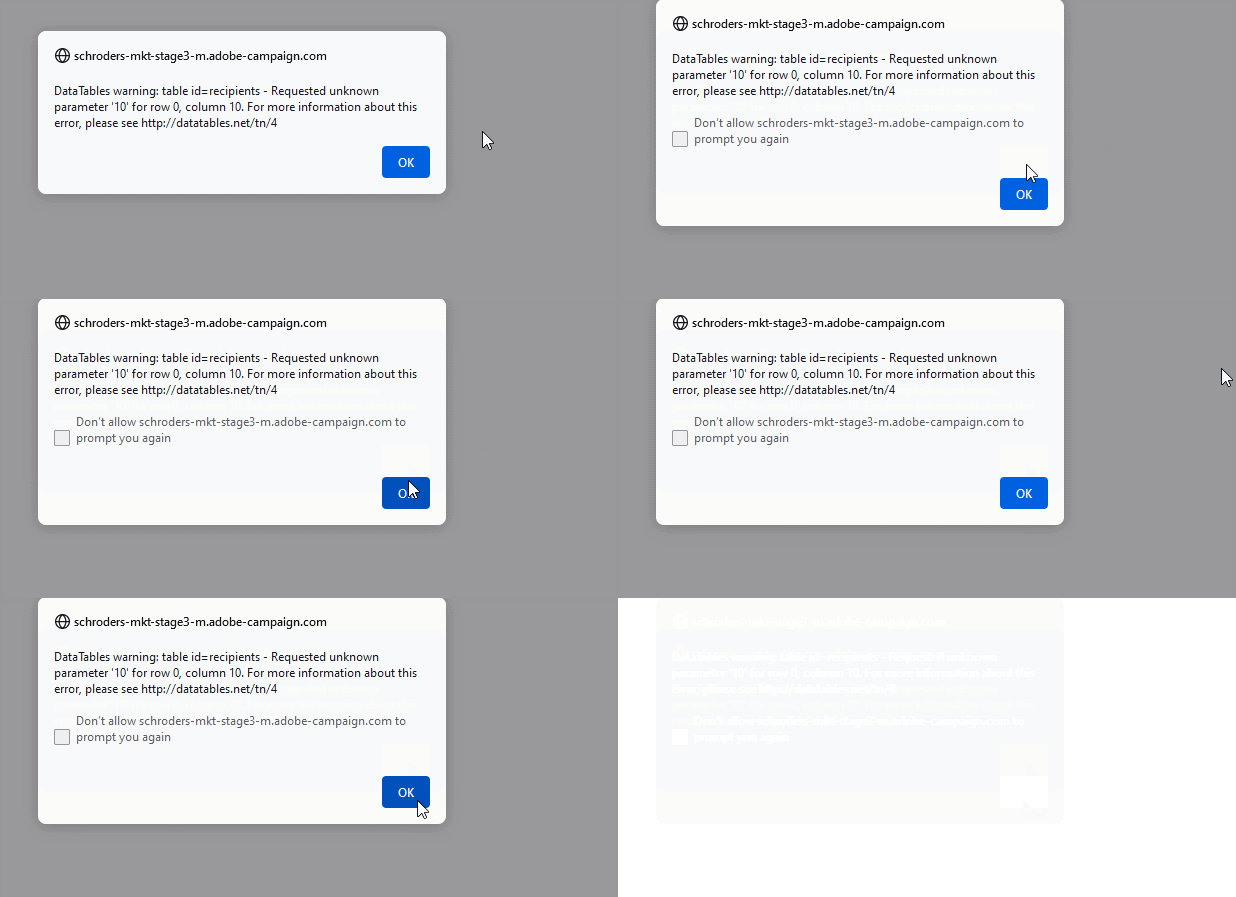
For some reason the service columns that are fetched dynamically are not being rendered, however, if I hardcode one service column for testing it renders fine.
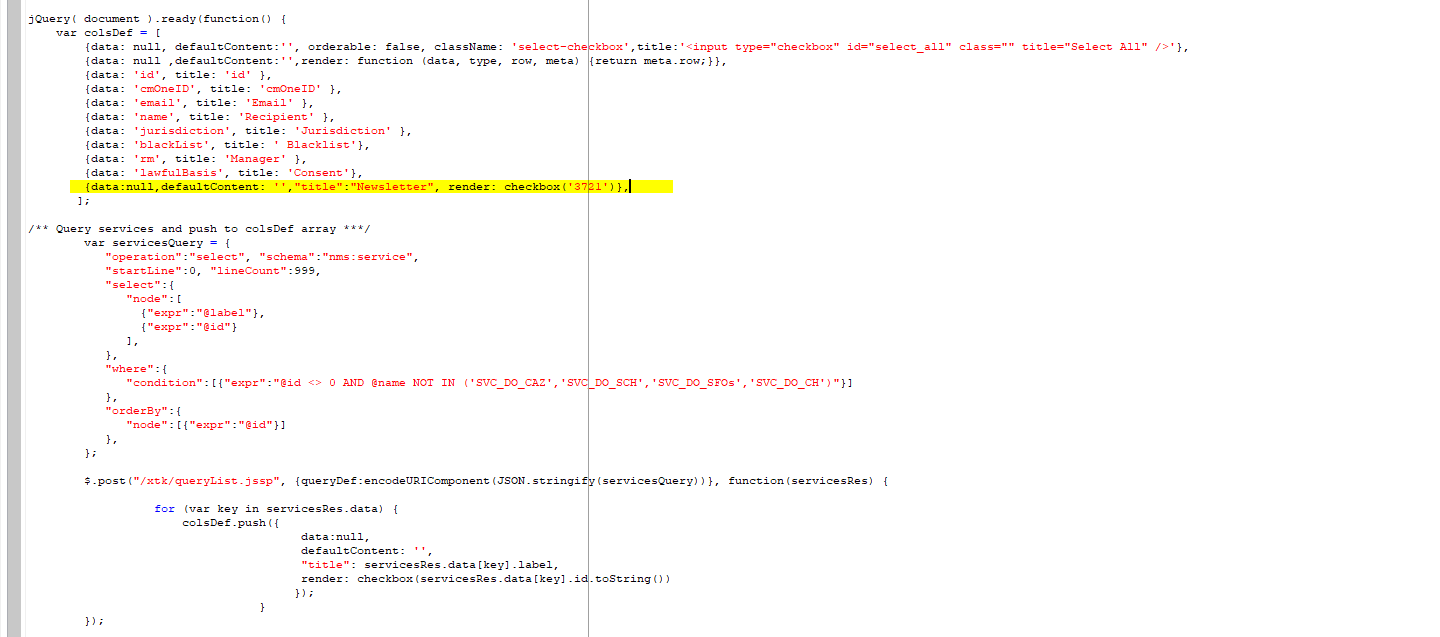
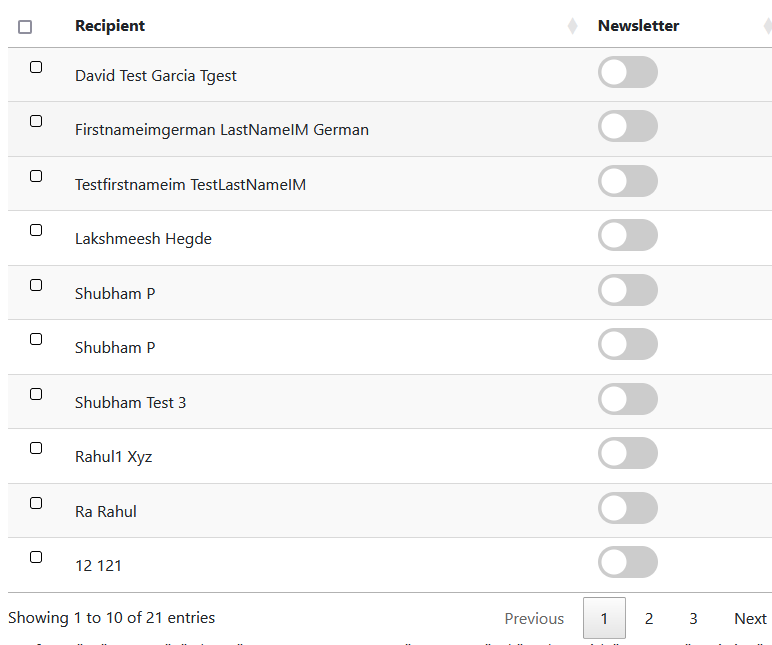
I added this from your last sample to redraw the table but doesnt work
Its hard to say without actually seeing the problem and the response data. I would first check the XHR response in line 50 using the browser's network inspector. Next debug the for loop in line 52 and the checkbox() function.
For help debugging please post a link to your page or a test case replicating the issue.
Kevin
Hi @kthorngren, the response is below, basically just the array of objects containing the id and the label of the services, I then iterate this array and create a new array with the structure used in our sandbox using the loop brlow, so Im pushing the new objects to the existing colsDef array, I can't share the webapp link as is only accessible through corporate vpn.
**
sample XHR RESPONSE servicesRes**
Here is the colsDef array with the above objects that were pushed, I am not sure at which point is the rendering of the buttons takes place? it seems that this is where the problem lies
render: checkbox(servicesRes.data[key].id.toString())Its difficult to debug code snippets. I would use the browser’s debugger to set breakpoints at the areas I suggested above. Trace the code to see what is happening.
Kevin
Okey I changed the logic and is working now, seems like by the time the table was taking the columns into consideration before the render was happening, so I changed it like below and is working now.
I iterated over the services and added a new key to the object containing the render function and then merge the services with the colsDef and worked fine.
http://live.datatables.net/zimerisa/8/edit