How do I update my X axis header title on highcharts from datatable?
How do I update my X axis header title on highcharts from datatable?
I am using Datatables to create Highcharts. Everything functions as intended, however I am not sure how to extract the X axis title from Column 1. (Data1, Data2, Data3, Data4, Data5 etc.). I am not sure what am I missing in my code. Any advice would be appreciated because I don't know much about Javascript. Thanks in advance.
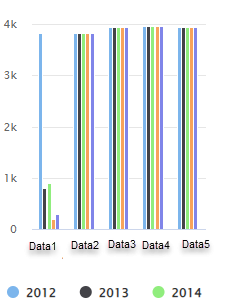
The chart should look like this. See screenshot below.
Link to code - http://live.datatables.net/muvoyacu/2/edit

This question has an accepted answers - jump to answer
Answers
Return an array of values in the getRow() function. The first is the chart and the second is the data from the first cell in the row. Like this:
http://live.datatables.net/muvoyacu/6/edit
Kevin
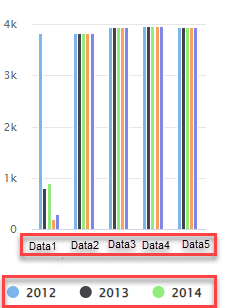
I am confused. Please see my screenshot. I want the legend to display Years and X axis to display column 1 data
.
Sorry, I guess you set the x axis with this:
You can use
column().data()to get the data for column 0 followed bytoArray()to turn it into a Javascript array, like this:http://live.datatables.net/muvoyacu/8/edit
But it doesn't seem like the right place to put
Data 1, etc.Maybe this is what you want:
http://live.datatables.net/muvoyacu/9/edit
I updated my example and just changed this line:
Kevin
Thankyou very much for your help and taking the time to help out.