RowGroup : calculate annual progress between 2 groups + other questions
RowGroup : calculate annual progress between 2 groups + other questions
Link to test case: https://live.datatables.net/mepisike/21/edit
Debugger code (debug.datatables.net):
Error messages shown:
Description of problem:
Hi,
I have multiple question about this table
https://live.datatables.net/mepisike/21/edit
First, I've created a test case but it doesn't work and I don't see any message in the console.
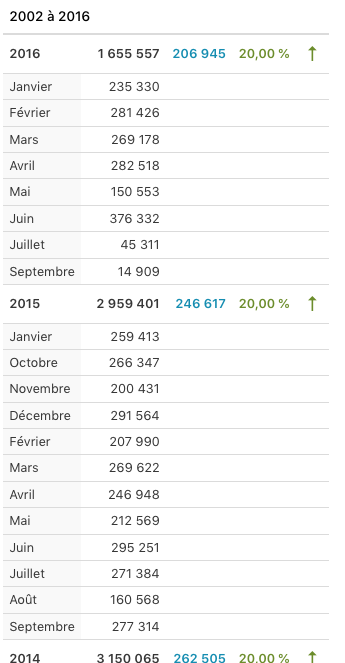
It's supposed to look like that : simple data for multiple years, grouped by year

At the end of the table, some calculation in the footer :

I have some questions/problems with this table :
1) I don't understand why the months are not sorted correctly even if I have created different return for sort and display (see for example 2015)
2) How can I count the number of groups in RowGroup (aka the number of years) ?
I have counted the years from the dates I have (end - begin) but it could give wrong results for the « average » calculation in the footer because some years could not exist if there is no information saved in the database.
3) I don't know how to calculate the annual progression between 2 years / 2 group (row group)
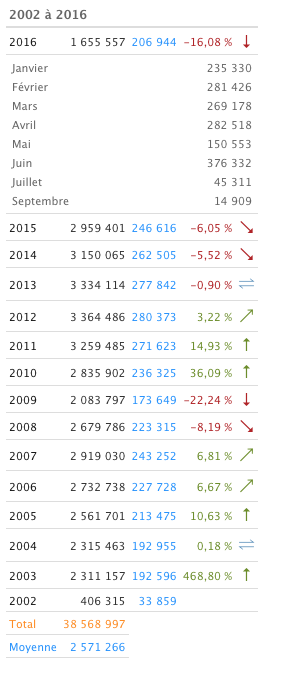
For example, the annual progression for 2016 ( -16,08 % ) is :
( ( 2016 average - 2015 average ) / 2015 average ) * 100
The annual progression must be on each Group/Year in the green column (where I put 20% by default just to show the column) except for the last group.
For the last group, I must not calculate the progression or hide the result because it had no sense/logic
I hope my questions are clear.
Thanks for your help
PS : At the end, it's supposed to look like that but created by datatable to replace a classic HTML table.
